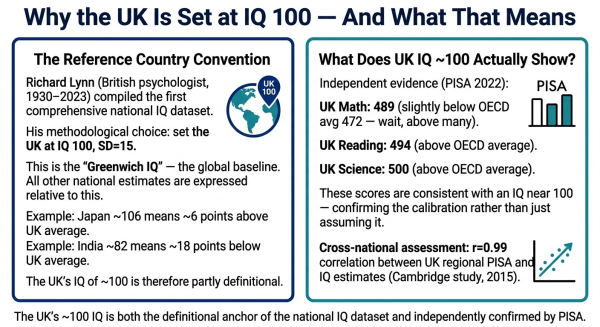
The United Kingdom occupies a unique position in the study of national intelligence that no other country shares: it is the reference country against which all other national IQ estimates are calibrated. Richard Lynn, the British psychologist who produced the most comprehensive national IQ datasets, set the UK at IQ 100, standard deviation 15 — the "Greenwich IQ" of the global cognitive comparison system. Every number in every national IQ ranking — from Japan's ~106 to India's ~76–82 — is expressed as a distance from this British baseline.
This makes the UK's own estimated IQ of approximately 99–101 simultaneously the most stable and the least informative number in the dataset: it is partly definitional. What makes the UK case genuinely interesting is not the average itself but two other findings that have attracted research attention: the documented regional variation within the UK (with a r = 0.99 correlation between regional IQ estimates and PISA scores across England, Scotland, Wales, and Northern Ireland), and mounting evidence of a reverse Flynn Effect — a plateau and possible modest decline in UK scores since the mid-1990s, particularly among the top-performing segment of the population.
This guide covers the UK's IQ data, its role as the global reference point, the regional variation within its borders, PISA performance trends, and what the reverse Flynn Effect debate means for Britain's cognitive trajectory.
The UK as the Global IQ Reference Point
Richard Lynn set the UK at IQ 100 as the reference anchor for his national IQ dataset for pragmatic reasons: he was a British researcher with the most extensive UK psychometric data available, and establishing a reference point with a well-studied, developed-country population allowed other nations to be expressed as deviations from a stable baseline. This methodology is sometimes called the "Greenwich IQ" — analogous to Greenwich Mean Time, a British-anchored convention that the world adopted for practical coordination.
The practical consequence is important to understand when interpreting national IQ data: the UK's estimated IQ of ~100 is both definitional (it was set to 100) and empirically supported (PISA and other independent assessments confirm UK performance near the global developed-country average). A more recent recalibration paper noted that because UK test scores appeared to be declining, a revised approach set IQ 100 to the average of seven historically comparable countries rather than UK alone — but the UK remained very close to 100 under this revised calibration.
The UK's IQ estimate from various current sources:
| Source | UK Estimate | Notes |
| Lynn reference baseline | 100.0 (definitional) | Set as the calibration anchor |
| Parra (2025) / Rindermann calibration | ~99.26 | "Roughly what UK's average psychometric IQ is compared to British Whites" |
| World Population Review (2026) | ~99–100 | Aggregated from multiple sources |
| PISA 2022 | Math 489 / Reading 494 / Science 500 | Consistent with IQ ~100; slightly below OECD average in maths |
| Compete High / One Education (2026) | 99–101 | Recent UK-specific analysis |
Independent of the definitional issue, the UK's PISA 2022 performance — 489 in mathematics, 494 in reading, 500 in science — places it solidly in the OECD mid-tier. PISA mathematics in particular has been a point of concern: the UK scored below the OECD average (472 is OECD average, but the UK's 489 is above it; however trends show it has slipped relative to earlier cycles). These scores are consistent with an average IQ near 100 and validate the reference-country calibration as empirically reasonable. For context on how PISA scores relate to IQ estimates, see our Japan IQ guide and our China IQ guide.
The Reverse Flynn Effect: Is UK Intelligence Declining?
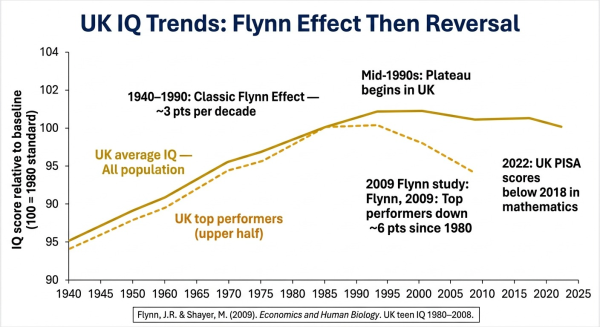
Throughout the 20th century, the UK — like virtually all developed nations — experienced the Flynn Effect: raw IQ scores rising by approximately 3 points per decade. Generations of British children grew measurably more capable on IQ tests than their parents and grandparents, driven by improving nutrition, expanding education, and increasingly complex cognitive environments.
Since the mid-1990s, this picture has become more complicated. Research — including a landmark 2009 study by James Flynn himself (co-authored with Michael Shayer) published in Economics and Human Biology — found that British teenagers' IQ scores had declined by an average of 2 points between 1980 and 2008, using the same test instruments administered to comparable age groups. More strikingly, among students in the top half of the IQ distribution — the highest-performing group — the decline reached approximately 6 points, effectively wiping out the gains of two previous decades for that subgroup.
This pattern — where the reverse Flynn Effect hits the top performers first — has been observed in other Northern European countries (Norway, Denmark, Sweden) as well as the UK. The causes remain debated, but proposed mechanisms include:
- Changing educational practices. Shifts in school curricula away from formal analytical reasoning (abstract mathematics, formal grammar, scientific logic) toward more applied and creative approaches may have reduced the specific cognitive training that IQ tests measure
- Digital technology and attention. The rise of passive screen-based leisure replacing cognitively demanding activities (reading, chess, structured problem-solving) may have reduced the out-of-school cognitive engagement that historically supported IQ gains
- Nutritional changes. Changes in diet composition — particularly reductions in omega-3 fatty acids and increases in processed food consumption — have been proposed as contributors, though evidence remains inconclusive
- Regression to the mean at the top. Some researchers suggest the gains among the upper distribution may have always been the most volatile, and their reversal reflects a natural ceiling effect rather than genuine decline
The reverse Flynn Effect is not unique to the UK and should not be interpreted as a specifically British failure. It reflects a broader pattern in high-income developed nations where the environmental gains that drove 20th-century IQ increases have plateaued, while new environmental pressures may be exerting modest downward pressure. For more on the Flynn Effect and what drives it, see our Japan IQ guide, where Japan's post-WWII gains are discussed, and our Vietnam guide, where Flynn Effect gains are still actively occurring.
Regional IQ Variation Within the UK
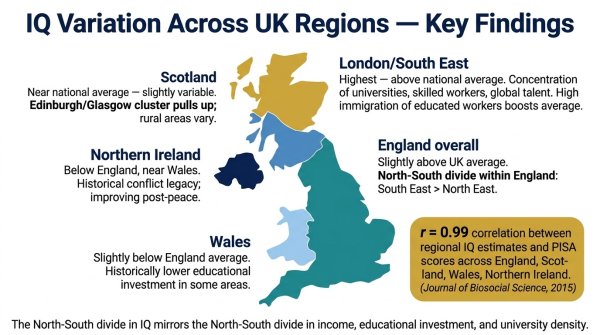
One of the most methodologically interesting findings in UK-specific intelligence research comes from a study published in the Journal of Biosocial Science (2015): IQ estimates for England, Scotland, Wales, and Northern Ireland derived from UK survey data show a r = 0.99 correlation with each nation's PISA scores. This near-perfect correlation between the psychometric IQ data and the independent PISA academic performance data provides unusually strong validation that the regional IQ variation is genuine rather than a measurement artefact.
The same study found that regional IQ estimates correlated only weakly (r = 0.24) with the regional IQ estimates assembled by Lynn in 1979 — suggesting that the relative cognitive performance of UK regions has shifted substantially over the past half-century, most likely due to differential rates of Flynn Effect gains, selective migration patterns, and regional economic divergence.
London and the South East consistently score above the UK national average in both IQ estimates and PISA performance. The concentration of world-leading universities (Oxford, Cambridge, Imperial, UCL, LSE), high-skilled employment sectors, and inflows of educated immigrants from around the world creates a cognitive clustering effect in the capital and surrounding region that substantially elevates the average. It is worth noting that London's schools, despite serving populations with the highest rates of poverty and deprivation among English regions, consistently produce among the highest PISA-equivalent outcomes — a phenomenon studied as the "London Effect" in educational research, attributed partly to concentrated educational investment and the characteristics of immigrant families.
Northern English regions — including the North East, Yorkshire, and parts of the North West — tend to score below the national average, reflecting the legacy of de-industrialisation, lower levels of educational attainment, and reduced access to high-quality higher education institutions. This North-South divide in cognitive performance mirrors the North-South divide in income and economic development that has been a persistent feature of the UK since the decline of manufacturing industries from the 1970s onward.
Scotland sits broadly near the national average overall, though with substantial internal variation between Edinburgh and Glasgow's urban cores and more rural regions. Scotland operates under a distinct education system (the Curriculum for Excellence) from the English national curriculum.
Wales and Northern Ireland tend to score somewhat below England, with Wales historically showing lower average educational attainment and Northern Ireland carrying the legacy of educational disruption from the period of conflict known as the Troubles.
UK in European and Global Context
| Country | IQ Estimate | PISA Math 2022 | Context |
| Netherlands | ~102 | 493 | Historically strong European performer |
| Germany | ~101 | 475 | Declined significantly in 2022 cycle |
| Finland | ~101 | 484 | Top EU academic performer historically |
| Ireland | ~100 | 492 | Above UK in most PISA domains |
| United Kingdom | ~99–100 | 489 | Reference baseline; declining trend |
| France | ~99 | 474 | Below UK on PISA despite similar estimate |
| Italy | ~97 | 471 | Below EU average |
| Spain | ~96 | 473 | Below EU average |
The UK sits in the competitive middle of European nations — substantially above Southern European countries, broadly comparable to Ireland and the Netherlands, and slightly below the historically strongest Nordic performers. The UK's PISA 2022 mathematics score of 489 placed it above the OECD average (472) but below high-performing European nations such as Switzerland (508), Estonia (510), and the Netherlands (493).
One notable feature of recent PISA cycles is that Ireland has outperformed the UK on multiple domains — particularly reading, where Ireland ranks among the top performers globally. This is significant given the historical framing of Ireland as cognitively inferior to England (a framing that research has consistently rejected as based on methodologically flawed data). On PISA 2022, Ireland scored 516 in reading compared to the UK's 494, a gap that corresponds to approximately 3 IQ points in favour of Ireland. For the full story of how that comparison evolved, see the broader national IQ series.
Against the global backdrop, the UK's ~100 sits 6 points below Japan (~106) and 5 below Singapore (~106) — the East Asian benchmark. This gap is consistent with the broader finding that East Asian nations with intensively analytical educational systems and strong cultural emphasis on academic achievement systematically outperform European nations at the population level, regardless of which European country is the comparison point.
The UK holds a unique position in global IQ research as the reference country against which all national estimates are calibrated — set at IQ 100, SD 15, by Richard Lynn. Its actual estimated IQ of approximately 99–101 is consistent with PISA performance and independent academic assessments. Within the UK, strong regional variation exists — with London and the South East significantly above average, and parts of Northern England, Wales, and Northern Ireland below — and this variation correlates at r = 0.99 with PISA scores, validating that it reflects genuine differences in cognitive performance. The most notable trend is evidence of a reverse Flynn Effect since the mid-1990s: UK average scores have plateaued and the top-performing tier declined by approximately 2–6 points between 1980 and 2008. The UK sits in the European mid-tier — competitive but not exceptional compared to top East Asian or Nordic performers.
For related guides, see our Japan IQ guide (the IQ leader), our China IQ guide, and our guides on India and Vietnam. For context on what these scores mean, see our IQ scale explained. Take our free IQ test — no registration, results in under 20 minutes.
Frequently Asked Questions
What is the average IQ in the UK?
The UK's average IQ is approximately 99–101, depending on source and year. The UK holds a unique position: it was set as the calibration reference point (IQ = 100) for the Lynn national IQ dataset. PISA 2022 scores (Math 489, Reading 494, Science 500) independently confirm UK performance near the global developed-country average.
Why is the UK used as the reference point for international IQ?
Richard Lynn, a British psychologist, set the UK at IQ 100, SD 15 as the anchor for his national IQ dataset — analogous to Greenwich Mean Time. All other national estimates are expressed relative to this British baseline. The choice reflects Lynn's access to high-quality UK psychometric data and his institutional base rather than any claim of UK cognitive superiority.
Is IQ declining in the UK?
There is evidence of plateau and modest decline since the mid-1990s. A 2009 Flynn and Shayer study found British teenagers declined by ~2 points on average and ~6 points among top performers between 1980 and 2008. This "Reverse Flynn Effect" is also documented in Norway and Denmark. Causes are debated: changing educational practices, digital technology effects on attention, and nutritional changes are all proposed contributors.
Are there regional IQ differences within the UK?
Yes. Research found significant regional variation with a remarkable r = 0.99 correlation between regional IQ estimates and PISA scores across England, Scotland, Wales, and Northern Ireland. London and South East England score above average; Northern England, Wales, and Northern Ireland score somewhat below, reflecting the UK's documented North-South economic and educational divide.
How does the UK compare to other European countries?
The UK (~99–100) sits in the European mid-tier — comparable to Ireland (~100), slightly below the Netherlands (~102) and top Nordic performers, and above France (~99), Italy (~97), and Spain (~96). On PISA 2022, Ireland outperformed the UK in reading (516 vs 494). Against East Asian nations, the UK trails Japan (~106) by approximately 6 IQ points.

Comments
Share Your Thoughts