Australia's estimated average IQ of approximately 102–104 places it above the global average, above the United Kingdom (~99–100), and above the United States (~98), while remaining below the top East Asian performers — Japan and Singapore at approximately 106. It is one of the more data-rich national IQ estimates in the global dataset: Australia has participated in PISA since 2000, providing a long time-series of nationally representative cognitive assessment data that independently validates the above-average placement.
But Australia's IQ story contains two important complications that most coverage overlooks. First, Australia's points-based skilled migration system — which specifically selects for education, occupational skill, and English proficiency — likely contributes meaningfully to an elevated national cognitive average that goes beyond what Australia's domestic education system alone would produce. Second, and more concerning, Australia's PISA scores have shown a long-term declining trend in all three subjects (mathematics, reading, and science) since 2000, according to the OECD's official 2022 country note — even as they remain above the OECD average.
This guide covers Australia's IQ data, the factors that drive its above-average performance, the PISA trend that raises questions about the direction of travel, and Australia's position in global and English-speaking world context.
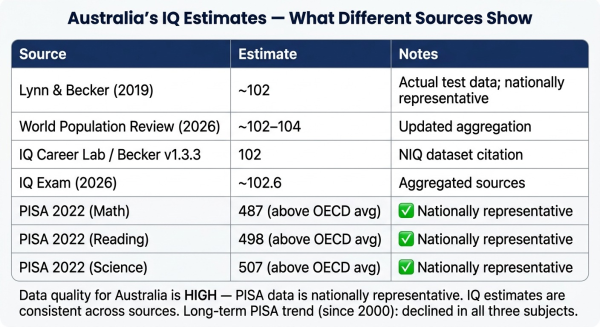
Australia's IQ Data: What the Sources Show
Australia's national IQ estimate is among the more consistent and better-supported in the global dataset. Unlike India (no PISA data, very wide estimate range) or China (urban-only PISA), Australia has participated in PISA with a nationally representative sample since 2000, providing 20+ years of cross-national cognitive comparison data:
| Source | Estimate | Notes |
| Lynn & Becker (2019) | ~102 | Based on actual test data; more reliable than many countries |
| World Population Review (2026) | ~102–104 | Updated aggregation across sources |
| PISA 2022 (Mathematics) | 487 | Above OECD average; nationally representative |
| PISA 2022 (Reading) | 498 | Above OECD average; nationally representative |
| PISA 2022 (Science) | 507 | Above OECD average; nationally representative |
| PISA trend 2000–2022 | Long-term decline in all 3 | ⚠️ OECD notes: declined in all subjects over the longer term |
Australia's data quality is high relative to many countries in the national IQ literature. PISA provides a nationally representative, methodologically consistent annual snapshot. The IQ estimate (~102) and PISA performance (above OECD average) are consistent with each other, providing mutual validation. Lynn grouped Australia with New Zealand in the same regional cognitive ability category (~99) in his framework, though individual country estimates from more recent sources place Australia somewhat higher.
For context on what these scores mean on the IQ scale, see our IQ scale explained. For comparison with the UK (the reference country), see our UK IQ guide.
The PISA Decline: Australia's Long-Term Trend
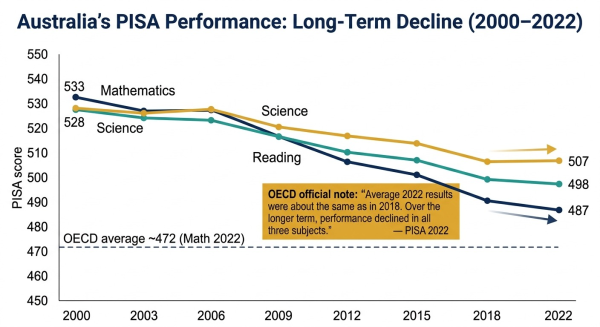
The OECD's official 2022 PISA country note for Australia states plainly: "Average 2022 results were about the same as in 2018 in mathematics, reading and science. While the most recent trend is stable, at least since 2015, over the longer term performance declined in all three subjects."
This is a significant finding. Australia began participating in PISA in 2000 with scores that were substantially above where they sit now. In mathematics, Australia's 2000 score was approximately 533, compared to 487 in 2022 — a decline of approximately 46 points over two decades. In reading: from approximately 528 to 498. In science: from approximately 528 to 507. Australia has fallen from a solid top-tier PISA performer at the start of the century to an above-average-but-not-exceptional performer by the 2020s.
Critically, Australia still scores above the OECD average in all three subjects in 2022. The decline is relative — Australia is still performing better than the average developed nation — but its performance gap over comparable nations has narrowed substantially. Canada, for example, has maintained more stable PISA performance over the same period. Japan and Singapore have remained dramatically above Australia throughout.
The causes of Australia's PISA decline are debated in education research and policy circles. Proposed contributing factors include:
- Curriculum changes. Shifts toward more holistic, project-based, and child-led learning approaches — at the expense of structured instruction in core analytical skills — have been proposed as reducing the specific cognitive preparation that PISA measures
- Teacher workforce issues. Changes in teacher training, increasing teacher shortage in STEM subjects, and challenges in attracting and retaining high-quality teachers — particularly in mathematics and science — in competing with higher-paying private sector careers
- Technology and attention. Similar to the UK's proposed reverse Flynn Effect mechanism, increased screen time and decreased engagement with cognitively demanding activities may have contributed to declining performance on analytical assessment tasks
- Equity concerns. The gap between high-socioeconomic and low-socioeconomic students in Australia is larger than in many comparable OECD nations, and the PISA decline may partly reflect under-investment in supporting lower-performing students
The stable 2018–2022 trend (no further decline in this cycle) may indicate that some educational reforms are beginning to stabilise performance, though it is too early to confirm a reversal of the longer-term trend.
What Drives Australia's Above-Average IQ
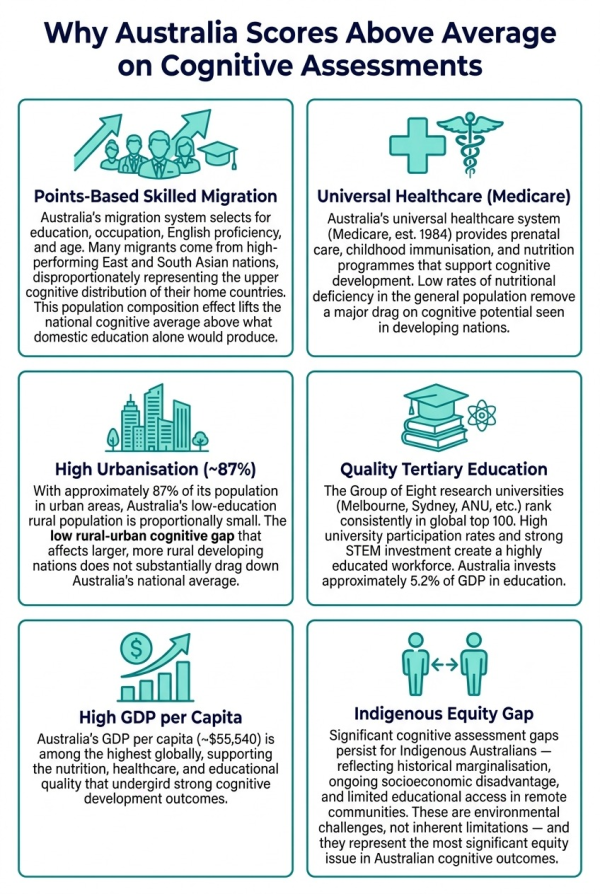
The Skilled Migration Factor
Australia's points-based skilled migration system is one of the most explicitly cognitively selective immigration systems in the world. Points are awarded for educational qualifications, occupation, age, English language proficiency, and employer sponsorship — all of which correlate with cognitive ability. The result is a migrant population that is disproportionately drawn from the upper cognitive distribution of their source countries.
A large and growing proportion of Australia's skilled migrants come from East and South Asian countries — nations where educational selection for emigration is particularly intense. These migrants — highly educated, professionally credentialled, English-proficient — represent the cognitive upper tail of already-high-performing populations. This creates a population composition effect that meaningfully elevates Australia's national cognitive average above what Australia's domestic education system and indigenous population distribution would suggest.
This is not a controversial claim — it is the expected consequence of designing an immigration system around cognitive and educational credentials. The effect is real, measurable in PISA and other assessment contexts (where the children of immigrant families often outperform domestic-born peers), and partially explains the gap between Australia's IQ estimate (~102–104) and the UK's (~99–100) despite broadly similar educational systems and cultural backgrounds.
Universal Healthcare and Nutrition
Australia's Medicare system — universal health coverage introduced in 1984 — provides prenatal care, childhood immunisation, and health screening that support optimal cognitive development across the socioeconomic range. Australia has low rates of the nutritional deficiencies (iodine, iron) that substantially impair cognitive development in many developing nations. For more on how these factors influence cognitive outcomes, see our guide on nutrition and IQ.
High Urbanisation
Approximately 87% of Australians live in urban areas — one of the highest urbanisation rates of any country globally. This means the low-education, low-nutrition rural population that significantly drags down the national averages of many developing nations is proportionally tiny in Australia's demographic structure. The country is effectively a network of high-quality urban environments with relatively few of the remote, under-resourced rural communities that create large within-country cognitive gaps in less developed nations.
The Indigenous Australian Equity Gap
One important within-country pattern must be addressed honestly: Indigenous Australians — approximately 3.8% of the population — face significant cognitive assessment disadvantage, documented consistently in PISA, NAPLAN, and other assessments. The gap reflects historical policies (including the Stolen Generations era of forced removal of Aboriginal children from families), ongoing socioeconomic disadvantage, remote community barriers to quality schooling and healthcare, and nutritional challenges in some communities.
These are environmental and historical disadvantages, not inherent cognitive limitations. They reflect the same pattern seen in any historically marginalised population facing the combination of educational deprivation, nutritional insecurity, and reduced healthcare access that we have documented in our guides on India and Vietnam. The Australian government's "Closing the Gap" initiative targets these disparities, though progress has been uneven. This gap is the most significant equity challenge in Australian cognitive outcomes — and its existence underscores that Australia's above-average national IQ estimate reflects the country's majority population, not its most disadvantaged communities.
Australia in Global and English-Speaking Context
| Country | IQ Estimate | PISA Math 2022 | Notes |
| Singapore | ~106 | 575 (#1) | East Asian benchmark |
| Japan | ~106 | 536 (#3) | East Asian benchmark |
| Australia | ~102–104 | 487 | Above average; long-term PISA decline |
| Canada | ~100 | 497 | More stable PISA trend than Australia |
| Ireland | ~100 | 492 | Above UK; improving trend |
| United Kingdom | ~99–100 | 489 | Reference country; see UK guide |
| New Zealand | ~100 | 479 | Similar system to Australia; similar decline |
| USA | ~98 | 465 | Below OECD average in mathematics |
Australia's position in the English-speaking world is consistently above average: it outperforms the UK, USA, New Zealand, and Canada on most IQ estimates, and matches or exceeds them on PISA in reading and science, while matching the UK and slightly trailing Canada in mathematics.
The most instructive comparison is with Canada. Both are large, English-speaking, Commonwealth nations with broadly similar immigration policies, educational systems, and economic development levels. Canada's PISA performance has been more stable over the 2000–2022 period, while Australia's has declined more substantially. This suggests the decline is not simply a product of being English-speaking or having a particular migration model — it reflects something specific to Australia's educational policy choices over this period.
Against the East Asian benchmark (Japan, Singapore), Australia trails by approximately 4–6 IQ points and substantially more on PISA mathematics — a gap consistent with the well-documented pattern that East Asian education systems, with their intensive mathematical preparation and high-stakes examination cultures, produce systematically stronger performance on analytical cognitive assessments than English-speaking systems with broader, more holistic curricula.
Australia's estimated average IQ of ~102–104 places it above the global average and above comparable English-speaking nations, driven by a combination of skilled migration selection, universal healthcare, high urbanisation, and above-average educational quality. PISA data — the most rigorous available source — confirms above-OECD-average performance in all three subjects in 2022, while also documenting a concerning long-term decline in all three subjects since 2000. Australia remains a strong cognitive performer by global standards, but its trajectory is less positive than its current standing suggests, and the Indigenous educational equity gap remains the most significant unresolved cognitive equity challenge in the country.
For related guides, see our UK IQ guide, our Japan IQ guide, and our discussion of nutrition and IQ. For context on what IQ scores mean, see our IQ scale explained. Take our free IQ test — no registration, results in under 20 minutes.
Frequently Asked Questions
What is the average IQ in Australia?
Australia's estimated average IQ is approximately 102–104, placing it above the global average (100) and above comparable English-speaking nations (UK ~100, USA ~98). PISA 2022 data — above OECD average in mathematics (487), reading (498), and science (507) — supports this above-average estimate. However, PISA scores have shown a long-term declining trend since 2000.
Why does Australia score higher than the UK?
Australia's higher estimate likely reflects its points-based skilled migration system selecting cognitively capable immigrants (many from high-performing East and South Asian nations), its high urbanisation rate (reducing the low-education rural population drag), and its universal healthcare system supporting strong cognitive development conditions.
Are PISA scores declining in Australia?
Yes. The OECD officially notes that while 2022 scores were stable compared to 2018, over the longer term, performance declined in all three subjects since 2000. Australia went from a top-tier PISA performer in 2000 to an above-average but no longer exceptional performer by 2022.
Does skilled immigration affect Australia's IQ estimate?
Yes, meaningfully. Australia's points-based migration system selects for education, occupation, and English proficiency — all correlating with cognitive ability. Many skilled migrants come from East and South Asian countries, disproportionately representing the upper cognitive distribution of their home nations. This population composition effect elevates Australia's national average.
What about Indigenous Australians?
Indigenous Australians (~3.8% of population) face significant cognitive assessment gaps due to historical marginalisation, ongoing socioeconomic disadvantage, and limited educational and healthcare access in remote communities. These are environmental disadvantages, not inherent cognitive limitations — and they represent Australia's most significant cognitive equity challenge.

Comments
Share Your Thoughts